本文最后更新于 2025年4月27日 晚上
方法一
1
2
3
4
5
6
7
8
9
10
11
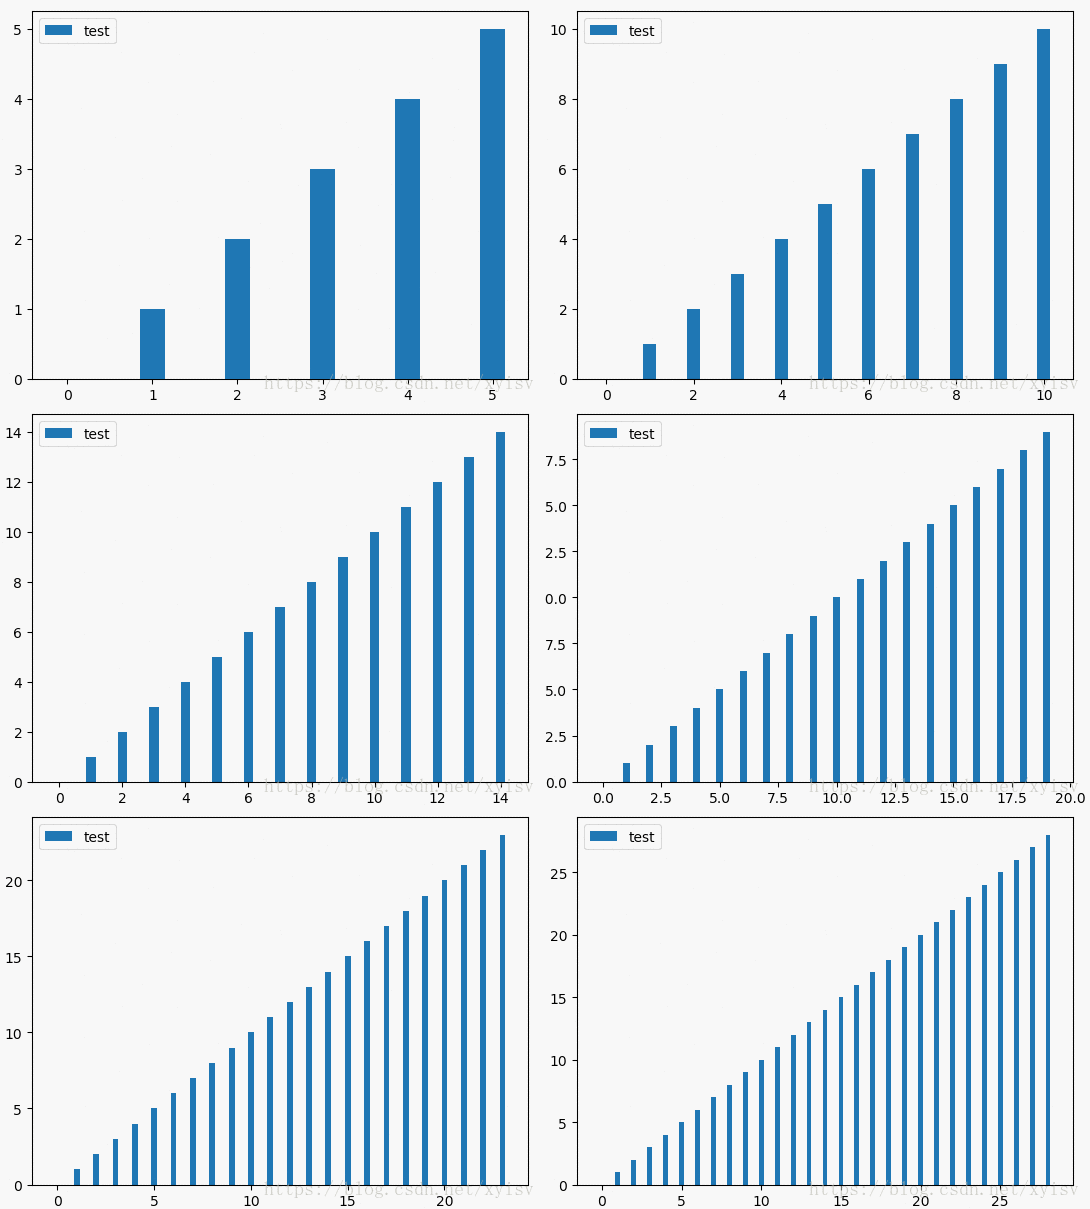
| import matplotlib.pyplot as plt
fig, ax = plt.subplots()
y = []
for i in range(50):
y.append(i)
ax.cla()
ax.bar(y, label='test', height=y, width=0.3)
ax.legend()
plt.pause(0.1)

|
方法二
1
2
3
4
5
6
7
8
9
10
11
12
13
14
15
16
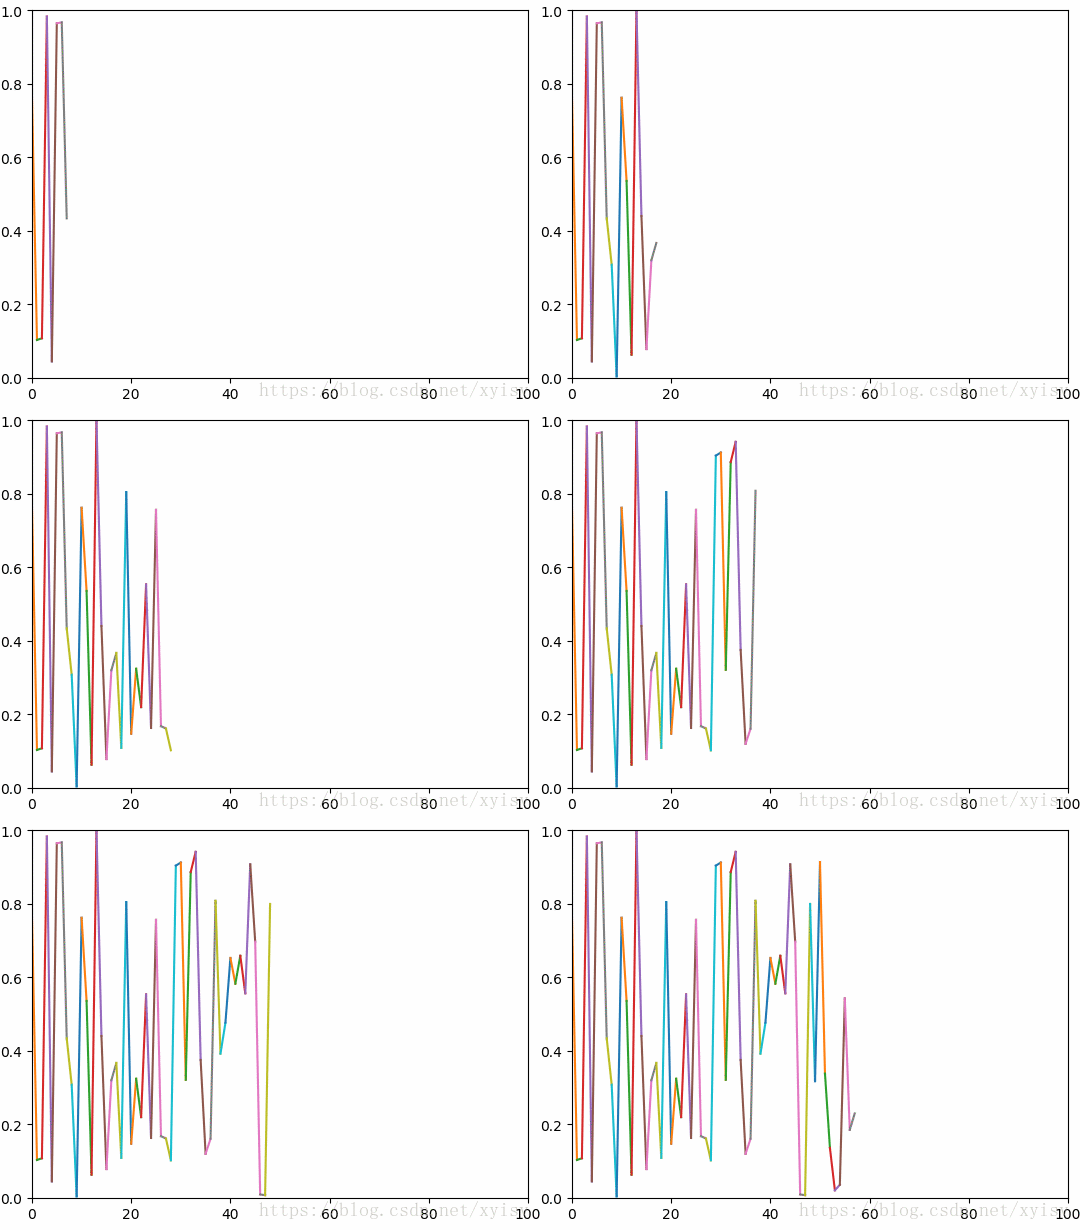
| import numpy as np
import matplotlib.pyplot as plt
plt.axis([0, 100, 0, 1])
plt.ion()
xs = [0, 0]
ys = [1, 1]
for i in range(100):
y = np.random.random()
xs[0] = xs[1]
ys[0] = ys[1]
xs[1] = i
ys[1] = y
plt.plot(xs, ys)
plt.pause(0.1)
|

原文https://blog.csdn.net/xyisv/article/details/80651334
以上均为转载,感觉例子不太具有普适性,可能以下方法更简单更普遍
1
2
3
4
5
| for i in range(num_iterations):
plt.cla()
plt.plot(...)
plt.pause(0.1)
|
